
Chris
Jul 14, 2015 · 3 min read
Interesting user experience with blood sugar

I did my own test a while ago on the effects of Keto Chow on my own blood sugar levels, though a customer (Hi Nick!) sent me an email today.
He looked this post over before I published it.
[/fusion_builder_column][/fusion_builder_row][/fusion_builder_container]
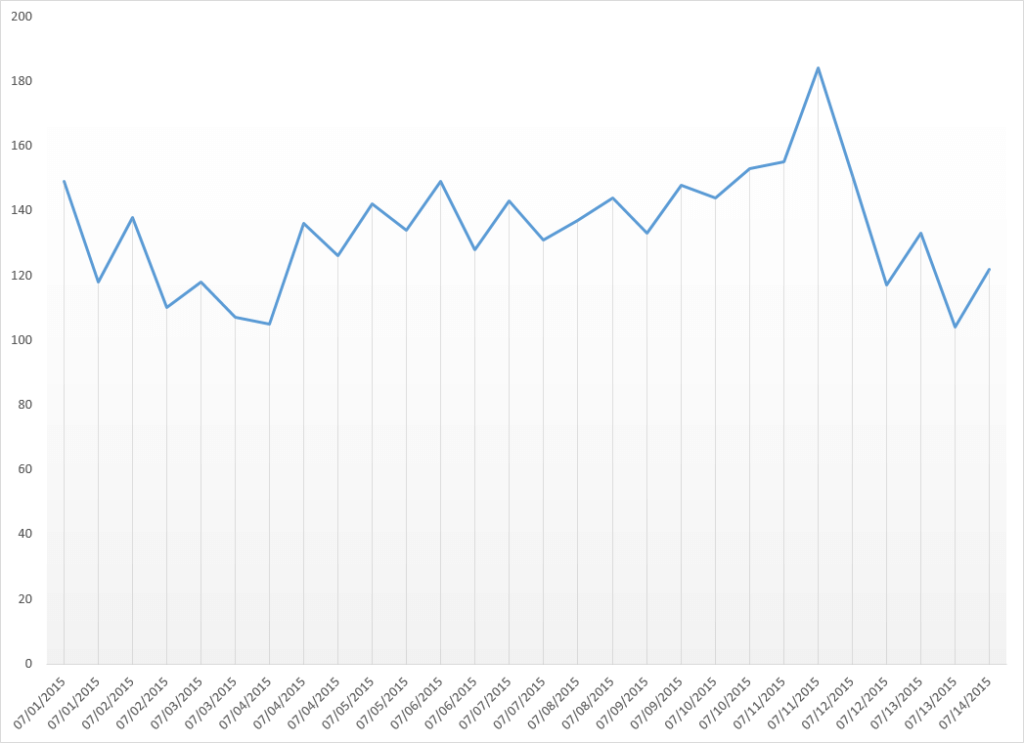
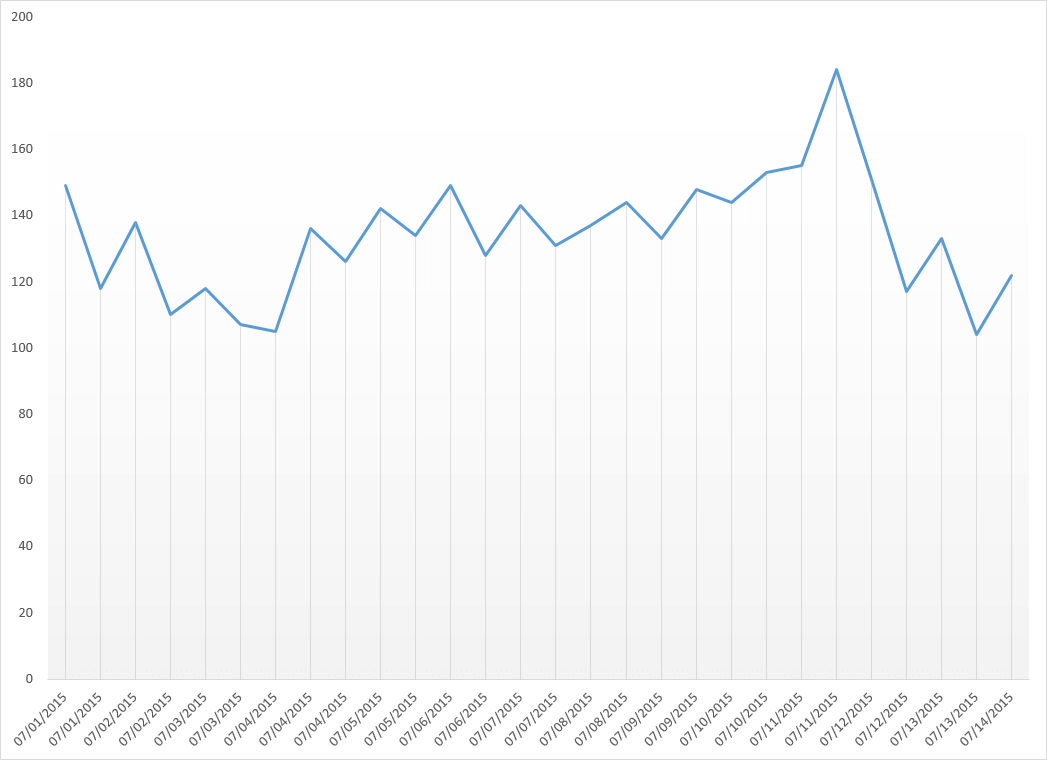
I am diabetic, and I’ve been taking daily measurements of blood glucose. The first week, my BG fell from around 150 to 107, and then as kind of a control I switched out one meal for ‘real food’ that I would have typically eaten and my BG rose throughout the week to a rather steep 180 on a night where I splurged a bit more than usual. Toning it back down to only the shakes and I had a [measurement] of 104 the other evening. Would the full graph be useful as public knowledge? I have measurements for ‘first thing in the morning’ and then two hours after dinner time. It’s not a cure for diabetes by any stretch, but, it has been helping me to manage my blood [glucose] and getting it into the 100 range reliably is only slightly high for a normal person, and in my opinion, very good for a diabetic. I’ve attached an export from the app I’m using. […] There’s notes about various things and weight measurements on some of them. The period 7/5 to 7/11 shows what my normal eating habits did to it, where as from 6/30 to 7/5 was all on keto chow with only the occasional snack and one day where I supplemented since I mixed up my numbers and prepared all 3 shakes for that day with an extremely low amount of … shake 😛 7/12 to today shows my glucose recovering after only a few days of turning down on the normal food again. Keto chow was at least two of my meals on every day throughout this two week period. I’m expecting the next two weeks to be a little more insightful, as there is lots of deviation in this chart that shows what happens with a diabetic eating normal food, and then what happens when I’m only on the keto chow shakes.If Nick decides to share the additional data I’ll post an update. So here is the data, first graphical and then the raw values and notes:
| Date | Time | Event | Value | Units | Notes |
| 06/30/2015 | 06:38 | Out Of Bed | 138 | mg/dL | 224.6 lbs. Start ketochow |
| 06/30/2015 | 09:54 | After Dinner | 120 | mg/dL | Soylent and a few chocolate raisins |
| 07/01/2015 | 06:25 | Out Of Bed | 149 | mg/dL | 224.4 |
| 07/01/2015 | 09:42 | After Dinner | 118 | mg/dL | |
| 07/02/2015 | 07:02 | Out Of Bed | 138 | mg/dL | 222 |
| 07/02/2015 | 10:43 | After Dinner | 110 | mg/dL | messed up shakes ate Jimmy John’s unwich instead |
| 07/03/2015 | 08:48 | After Dinner | 118 | mg/dL | |
| 07/03/2015 | 10:06 | Out Of Bed | 107 | mg/dL | 220 lbs |
| 07/04/2015 | 04:55 | Before Dinner | 105 | mg/dL | |
| 07/04/2015 | 06:01 | Out Of Bed | 136 | mg/dL | Had 2 hotdogs as a late night snack |
| 07/04/2015 | 10:17 | After Dinner | 126 | mg/dL | |
| 07/05/2015 | 09:46 | After Dinner | 142 | mg/dL | ate fries and double quarter pounder |
| 07/05/2015 | 09:57 | Out Of Bed | 134 | mg/dL | |
| 07/06/2015 | 06:47 | Out Of Bed | 149 | mg/dL | |
| 07/06/2015 | 09:10 | After Dinner | 128 | mg/dL | |
| 07/07/2015 | 06:35 | Out Of Bed | 143 | mg/dL | |
| 07/07/2015 | 10:17 | After Dinner | 131 | mg/dL | Chicken and broccoli |
| 07/08/2015 | 06:24 | Out Of Bed | 137 | mg/dL | |
| 07/08/2015 | 10:02 | After Dinner | 144 | mg/dL | |
| 07/09/2015 | 06:43 | Out Of Bed | 133 | mg/dL | Large steak for dinner last night |
| 07/09/2015 | 10:34 | After Dinner | 148 | mg/dL | |
| 07/10/2015 | 07:16 | Out Of Bed | 144 | mg/dL | |
| 07/10/2015 | 09:58 | Before Bed | 153 | mg/dL | |
| 07/11/2015 | 09:27 | Out Of Bed | 155 | mg/dL | |
| 07/11/2015 | 11:27 | After Dinner | 184 | mg/dL | ate out at Chili’s splurged on chips and salsa |
| 07/12/2015 | 08:58 | Out Of Bed | 151 | mg/dL | |
| 07/12/2015 | 10:31 | After Dinner | 117 | mg/dL | |
| 07/13/2015 | 09:00 | Out Of Bed | 133 | mg/dL | |
| 07/13/2015 | 10:05 | After Dinner | 104 | mg/dL | |
| 07/14/2015 | 06:10 | Out Of Bed | 122 | mg/dL |

President
Chris Bair is a technology and computer geek. He became involved in the nutritionally complete "future foods" movement in January 2014, originally with a conventional recipe and later switching to a high fat, low carb "ketogenic" variant on October 2014. In January 2015 he created the recipe for Keto Chow and released it without restriction for anyone to use, at the same time he began mixing the recipe up for people that wanted a finished product and has seen steady growth in the business every month since.
Recommended For You


Categories
Popular Products